Daily data#
In this example, we load a year of daily data and make some static plots with Matplotlib.
import matplotlib.pyplot as plt

import uscrn
Get data#
With uscrn.get_data(), we get back a pandas.DataFrame.
%%time

df = uscrn.get_data(2019, "daily")
df
| wban | lst_date | crx_vn | longitude | latitude | t_daily_max | t_daily_min | t_daily_mean | t_daily_avg | p_daily_calc | ... | soil_moisture_5_daily | soil_moisture_10_daily | soil_moisture_20_daily | soil_moisture_50_daily | soil_moisture_100_daily | soil_temp_5_daily | soil_temp_10_daily | soil_temp_20_daily | soil_temp_50_daily | soil_temp_100_daily | |
|---|---|---|---|---|---|---|---|---|---|---|---|---|---|---|---|---|---|---|---|---|---|
| 0 | 23583 | 2019-10-09 | 2.514 | -158.610001 | 59.279999 | NaN | NaN | NaN | NaN | NaN | ... | NaN | NaN | NaN | NaN | NaN | NaN | NaN | NaN | NaN | NaN |
| 1 | 23583 | 2019-10-10 | 2.514 | -158.610001 | 59.279999 | NaN | NaN | NaN | NaN | 0.0 | ... | NaN | NaN | NaN | NaN | NaN | NaN | NaN | NaN | NaN | NaN |
| 2 | 23583 | 2019-10-11 | 2.514 | -158.610001 | 59.279999 | 7.7 | -2.4 | 2.7 | 2.5 | 0.0 | ... | NaN | NaN | NaN | NaN | NaN | NaN | NaN | NaN | NaN | NaN |
| 3 | 23583 | 2019-10-12 | 2.514 | -158.610001 | 59.279999 | 6.2 | -3.5 | 1.3 | 0.8 | 0.0 | ... | NaN | NaN | NaN | NaN | NaN | NaN | NaN | NaN | NaN | NaN |
| 4 | 23583 | 2019-10-13 | 2.514 | -158.610001 | 59.279999 | 6.3 | -2.8 | 1.7 | 1.2 | 0.0 | ... | NaN | NaN | NaN | NaN | NaN | NaN | NaN | NaN | NaN | NaN |
| ... | ... | ... | ... | ... | ... | ... | ... | ... | ... | ... | ... | ... | ... | ... | ... | ... | ... | ... | ... | ... | ... |
| 56289 | 94088 | 2019-12-27 | 2.622 | -104.440002 | 44.520000 | -0.4 | -10.1 | -5.2 | -4.9 | 0.0 | ... | NaN | NaN | 0.313 | 0.348 | 0.457 | -0.5 | -0.1 | 0.3 | 1.1 | 2.2 |
| 56290 | 94088 | 2019-12-28 | 2.622 | -104.440002 | 44.520000 | -5.0 | -11.0 | -8.0 | -8.5 | 0.0 | ... | NaN | NaN | NaN | 0.347 | 0.455 | -0.7 | -0.3 | 0.2 | 1.1 | 2.2 |
| 56291 | 94088 | 2019-12-29 | 2.622 | -104.440002 | 44.520000 | -9.0 | -11.2 | -10.1 | -10.1 | 2.8 | ... | NaN | NaN | NaN | 0.346 | 0.456 | -0.8 | -0.4 | 0.1 | 1.0 | 2.1 |
| 56292 | 94088 | 2019-12-30 | 2.622 | -104.440002 | 44.520000 | -5.8 | -13.0 | -9.4 | -9.3 | 0.0 | ... | NaN | NaN | NaN | 0.346 | 0.456 | -1.1 | -0.5 | 0.1 | 1.0 | 2.1 |
| 56293 | 94088 | 2019-12-31 | 2.622 | -104.440002 | 44.520000 | 1.6 | -7.6 | -3.0 | -2.2 | 0.0 | ... | NaN | NaN | NaN | 0.347 | 0.454 | -1.2 | -0.6 | 0.0 | 0.9 | 2.0 |
56294 rows × 28 columns
df.info()
<class 'pandas.core.frame.DataFrame'>
RangeIndex: 56294 entries, 0 to 56293
Data columns (total 28 columns):
 #   Column                   Non-Null Count  Dtype
---  ------                   --------------  -----
 0   wban                     56294 non-null  object
 1   lst_date                 56294 non-null  datetime64[ns]
 2   crx_vn                   56024 non-null  object
 3   longitude                56294 non-null  float32
 4   latitude                 56294 non-null  float32
 5   t_daily_max              55580 non-null  float32
 6   t_daily_min              55579 non-null  float32
 7   t_daily_mean             55577 non-null  float32
 8   t_daily_avg              55552 non-null  float32
 9   p_daily_calc             54890 non-null  float32
 10  solarad_daily            50009 non-null  float32
 11  sur_temp_daily_type      56294 non-null  object
 12  sur_temp_daily_max       49745 non-null  float32
 13  sur_temp_daily_min       49746 non-null  float32
 14  sur_temp_daily_avg       49746 non-null  float32
 15  rh_daily_max             49019 non-null  float32
 16  rh_daily_min             49019 non-null  float32
 17  rh_daily_avg             49019 non-null  float32
 18  soil_moisture_5_daily    33154 non-null  float32
 19  soil_moisture_10_daily   35001 non-null  float32
 20  soil_moisture_20_daily   28039 non-null  float32
 21  soil_moisture_50_daily   27850 non-null  float32
 22  soil_moisture_100_daily  27044 non-null  float32
 23  soil_temp_5_daily        39246 non-null  float32
 24  soil_temp_10_daily       39583 non-null  float32
 25  soil_temp_20_daily       31306 non-null  float32
 26  soil_temp_50_daily       30825 non-null  float32
 27  soil_temp_100_daily      30656 non-null  float32
dtypes: datetime64[ns](1), float32(24), object(3)
memory usage: 6.9+ MB
Dataset and variable attributes are stored under .attrs.
list(df.attrs)
['which', 'title', 'created', 'source', 'attrs', 'notes']
some_keys = ["which", "title", "created", "source"]
for key in some_keys:
    print(f"{key:{max(len(key) for key in some_keys) + 1}}", df.attrs[key])
which    daily
title    U.S. Climate Reference Network (USCRN) | daily | 2019
created  2024-01-27 15:50:51.784080+00:00
source   https://www.ncei.noaa.gov/pub/data/uscrn/products/daily01
Plot temperature#
vn = "t_daily_avg"

df.attrs["attrs"][vn]
{'name': 't_daily_avg',
 'long_name': 'daily average air temperature',
 'units': 'degree_Celsius',
 'description': 'Average air temperature, in degrees C. See Note F.',
 'dtype': 'float32',
 'xarray_only': False,
 'categories': False}
df_ = df[["wban", "lst_date", "latitude", "longitude", vn]]

fig, ax = plt.subplots(figsize=(10, 5), tight_layout=True)

# Individual site time series
df_.groupby("wban").plot(x="lst_date", y="t_daily_avg", ax=ax, c="0.7", lw=0.5, alpha=0.35, legend=False)

# Mean and median
agg = df_.groupby(df_.lst_date)[[vn]].agg(("mean", "median"))
agg[vn]["median"].plot(x="lst_date", y="t_daily_avg", ax=ax, c="0.3", lw=1.8, ls="--", legend=False)
agg[vn]["mean"].plot(x="lst_date", y="t_daily_avg", ax=ax, c="0.3", lw=2, legend=False)

ax.set_title(df.attrs["title"], loc="left", size=10)

ax.set(
    xlabel="",
    ylabel=f"{df.attrs['attrs'][vn]['long_name']} [{df.attrs['attrs'][vn]['units']}]",
);

Soil with xarray#
With uscrn.to_xarray(), we convert to xarray.Dataset.
ds = uscrn.to_xarray(df)

# Shorten notes so less space taken viewing the Dataset
lines = ds.attrs["notes"].splitlines()
for i, line in enumerate(lines):
    if line.lstrip().startswith("D."):
        break
else:
    i = 7
ds.attrs["notes"] = "\n".join(lines[:i] + [f"... ({len(lines) - i} more lines)"])

ds
<xarray.Dataset>
Dimensions:              (site: 155, time: 365, depth: 5)
Coordinates:
    wban                 (site) object '03047' '03048' ... '96408' '96409'
  * time                 (time) datetime64[ns] 2019-01-01 ... 2019-12-31
    longitude            (site) float32 -102.8 -106.9 -102.8 ... -150.9 -149.4
    latitude             (site) float32 31.62 34.36 33.96 ... 66.56 63.45 68.65
  * depth                (depth) float64 5.0 10.0 20.0 50.0 100.0
Dimensions without coordinates: site
Data variables: (12/16)
    crx_vn               (site, time) object '2.622' '2.622' ... '2.514' '2.514'
    t_daily_max          (site, time) float32 6.1 0.0 12.5 ... -26.4 -28.9 -29.4
    t_daily_min          (site, time) float32 -3.4 -3.2 -5.4 ... -32.8 -31.1
    t_daily_mean         (site, time) float32 1.3 -1.6 3.6 ... -30.4 -30.8 -30.3
    t_daily_avg          (site, time) float32 -1.5 -1.6 3.4 ... -30.7 -30.1
    p_daily_calc         (site, time) float32 0.0 0.0 0.0 0.0 ... 0.0 0.4 3.0
    ...                   ...
    sur_temp_daily_avg   (site, time) float32 -0.2 0.4 2.6 ... -32.3 -29.0 -28.8
    rh_daily_max         (site, time) float32 84.4 92.4 94.0 ... 75.1 81.4 79.0
    rh_daily_min         (site, time) float32 47.4 71.7 17.7 ... 51.6 68.7 68.6
    rh_daily_avg         (site, time) float32 75.6 81.8 54.7 ... 65.1 77.0 76.2
    soil_moisture_daily  (depth, site, time) float32 0.048 0.048 ... nan nan
    soil_temp_daily      (depth, site, time) float32 3.9 3.2 4.7 ... nan nan nan
Attributes:
    title:    U.S. Climate Reference Network (USCRN) | daily | 2019
    created:  2024-01-27 15:50:56.334536+00:00
    source:   https://www.ncei.noaa.gov/pub/data/uscrn/products/daily01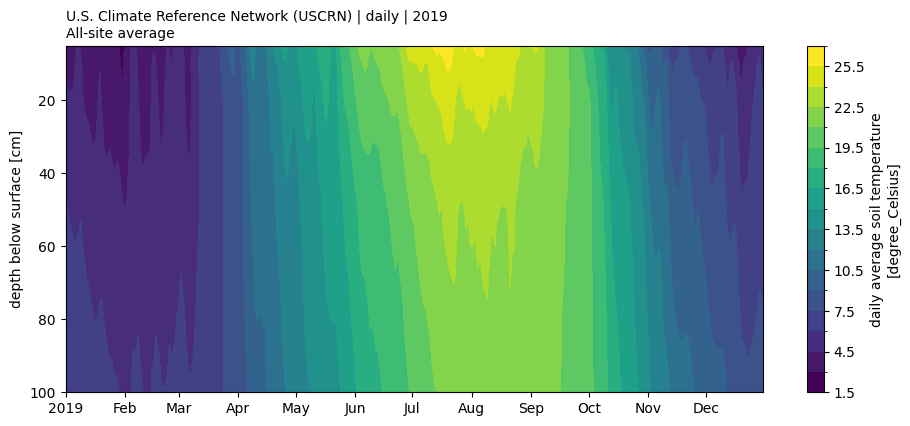
notes: Notes from https://www.ncei.noaa.gov/pub/data/uscrn/products/da...ds.soil_temp_daily.mean(dim="site", keep_attrs=True).plot.contourf(levels=20, size=4.5, aspect=2.5)
ax = plt.gca()
ax.invert_yaxis()
ax.set_title(f"{ds.title}\nAll-site average", loc="left", size=10)
ax.set(xlabel="");